Note
Go to the end to download the full example code
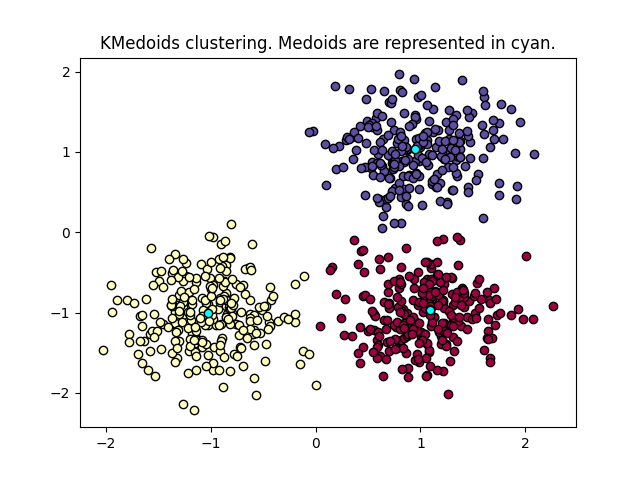
KMedoids Demo
KMedoids clustering of data points. The goal is to find medoids than minimize the sum of absolute distance to the closest medoid. A medoid is a point of the dataset. Read more in the User Guide.
import matplotlib.pyplot as plt
import numpy as np

from sklearn_extra.cluster import KMedoids
from sklearn.datasets import make_blobs


print(__doc__)

# #############################################################################
# Generate sample data
centers = [[1, 1], [-1, -1], [1, -1]]
X, labels_true = make_blobs(
    n_samples=750, centers=centers, cluster_std=0.4, random_state=0
)

# #############################################################################
# Compute Kmedoids clustering
cobj = KMedoids(n_clusters=3).fit(X)
labels = cobj.labels_
Plot results
unique_labels = set(labels)
colors = [
    plt.cm.Spectral(each) for each in np.linspace(0, 1, len(unique_labels))
]
for k, col in zip(unique_labels, colors):
    class_member_mask = labels == k

    xy = X[class_member_mask]
    plt.plot(
        xy[:, 0],
        xy[:, 1],
        "o",
        markerfacecolor=tuple(col),
        markeredgecolor="k",
        markersize=6,
    )

plt.plot(
    cobj.cluster_centers_[:, 0],
    cobj.cluster_centers_[:, 1],
    "o",
    markerfacecolor="cyan",
    markeredgecolor="k",
    markersize=6,
)

plt.title("KMedoids clustering. Medoids are represented in cyan.")
Text(0.5, 1.0, 'KMedoids clustering. Medoids are represented in cyan.')
Total running time of the script: ( 0 minutes 0.259 seconds)