Note
Go to the end to download the full example code
Common-nearest-neighbor clustering demo I
Common-nearest neighbor clustering of data points following a density criterion. Two points will be part of the same cluster if they share a minimum number of common neighbors. Read more in the User Guide.
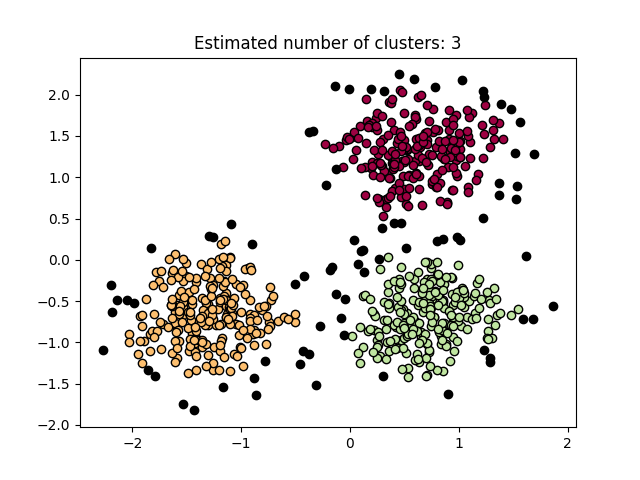
Estimated number of clusters: 3
Estimated number of noise points: 79
Homogeneity: 0.895
Completeness: 0.745
V-measure: 0.813
Adjusted Rand Index: 0.835
Adjusted Mutual Information: 0.813
Silhouette Coefficient: 0.560

Text(0.5, 1.0, 'Estimated number of clusters: 3')
import matplotlib.pyplot as plt
import numpy as np

from sklearn_extra.cluster import CommonNNClustering
from sklearn import metrics
from sklearn.datasets import make_blobs
from sklearn.preprocessing import StandardScaler


print(__doc__)

# #############################################################################
# Generate sample data
centers = [[1, 1], [-1, -1], [1, -1]]
X, labels_true = make_blobs(
    n_samples=750, centers=centers, cluster_std=0.4, random_state=0
)

X = StandardScaler().fit_transform(X)

# #############################################################################
# Compute common-nearest-neighbor clustering
cobj = CommonNNClustering(eps=0.3, min_samples=8).fit(X)
labels = cobj.labels_

# Number of clusters in labels, ignoring noise if present.
n_clusters_ = len(set(labels)) - (1 if -1 in labels else 0)
n_noise_ = list(labels).count(-1)

print("Estimated number of clusters: %d" % n_clusters_)
print("Estimated number of noise points: %d" % n_noise_)
print("Homogeneity: %0.3f" % metrics.homogeneity_score(labels_true, labels))
print("Completeness: %0.3f" % metrics.completeness_score(labels_true, labels))
print("V-measure: %0.3f" % metrics.v_measure_score(labels_true, labels))
print(
    "Adjusted Rand Index: %0.3f"
    % metrics.adjusted_rand_score(labels_true, labels)
)
print(
    "Adjusted Mutual Information: %0.3f"
    % metrics.adjusted_mutual_info_score(labels_true, labels)
)
print("Silhouette Coefficient: %0.3f" % metrics.silhouette_score(X, labels))

# #############################################################################
# Plot result

# Black removed and is used for noise instead.
unique_labels = set(labels)
colors = [
    plt.cm.Spectral(each) for each in np.linspace(0, 1, len(unique_labels))
]
for k, col in zip(unique_labels, colors):
    if k == -1:
        # Black used for noise.
        col = [0, 0, 0, 1]

    class_member_mask = labels == k

    xy = X[class_member_mask]
    plt.plot(
        xy[:, 0],
        xy[:, 1],
        "o",
        markerfacecolor=tuple(col),
        markeredgecolor="k",
        markersize=6,
    )

plt.title("Estimated number of clusters: %d" % n_clusters_)
Total running time of the script: ( 0 minutes 0.181 seconds)