Note
Go to the end to download the full example code
Comparison of EigenPro and SVC on Digit Classification
Here we train a EigenPro Classifier and a Support Vector Classifier (SVC) on a synthetically generated binary classification problem. We halt the training of EigenPro after two epochs. While EigenPro is slower on low dimensional datasets, as the number of features exceeds 500, it begins to outperform SVM and shows more stability.
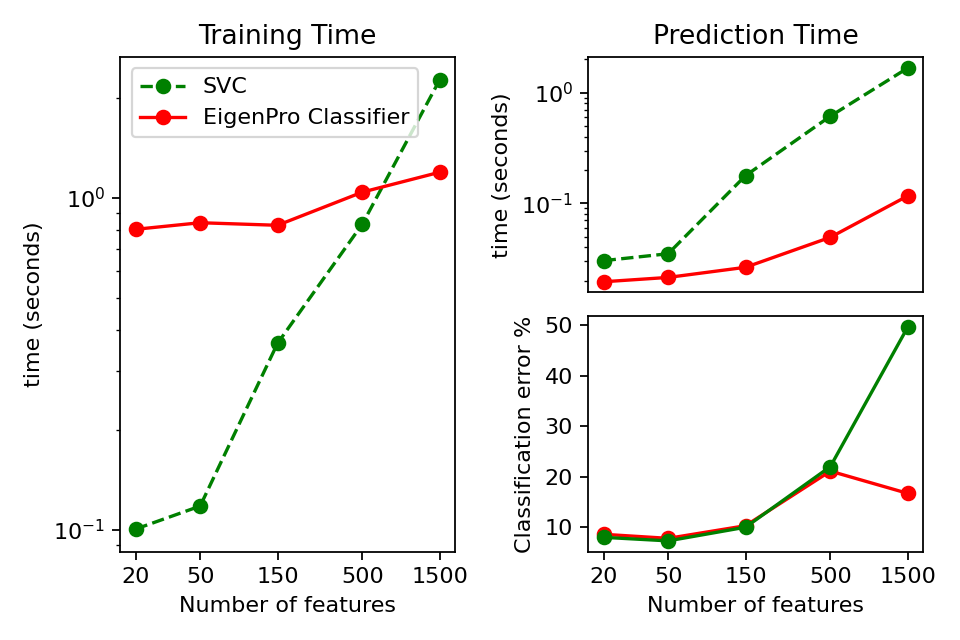
EigenPro Classification with 20 features in 0.82 seconds. Error: 8.6
SupportVector Classification with 20 features in 0.13 seconds. Error: 8.0
EigenPro Classification with 50 features in 0.86 seconds. Error: 7.8
SupportVector Classification with 50 features in 0.15 seconds. Error: 7.3
EigenPro Classification with 150 features in 0.85 seconds. Error: 10.3
SupportVector Classification with 150 features in 0.54 seconds. Error: 10.0
EigenPro Classification with 500 features in 1.09 seconds. Error: 21.1
SupportVector Classification with 500 features in 1.45 seconds. Error: 22.0
EigenPro Classification with 1500 features in 1.31 seconds. Error: 16.7
SupportVector Classification with 1500 features in 3.94 seconds. Error: 49.6
print(__doc__)

import matplotlib
import matplotlib.pyplot as plt
import numpy as np
from time import time

from sklearn.datasets import make_classification
from sklearn_extra.kernel_methods import EigenProClassifier
from sklearn.svm import SVC

rng = np.random.RandomState(1)

train_size = 2000
test_size = 1000

# Run tests comparing eig to svc
eig_fit_times = []
eig_pred_times = []
eig_err = []
svc_fit_times = []
svc_pred_times = []
svc_err = []

feature_counts = [20, 50, 150, 500, 1500]
gamma = 0.008

# Fit models to data
for n_features in feature_counts:
    x, y = make_classification(
        n_samples=train_size + test_size,
        n_features=n_features,
        random_state=rng,
    )

    x_train = x[:train_size]
    y_train = y[:train_size]
    x_test = x[train_size:]
    y_test = y[train_size:]
    for name, estimator in [
        (
            "EigenPro",
            EigenProClassifier(
                n_epoch=2, gamma=gamma, n_components=400, random_state=rng
            ),
        ),
        ("SupportVector", SVC(gamma=gamma, random_state=rng)),
    ]:
        stime = time()
        estimator.fit(x_train, y_train)
        fit_t = time() - stime

        stime = time()
        y_pred_test = estimator.predict(x_test)
        pred_t = time() - stime

        err = 100.0 * np.sum(y_pred_test != y_test) / len(y_test)
        if name == "EigenPro":
            eig_fit_times.append(fit_t)
            eig_pred_times.append(pred_t)
            eig_err.append(err)
        else:
            svc_fit_times.append(fit_t)
            svc_pred_times.append(pred_t)
            svc_err.append(err)
        print(
            "%s Classification with %i features in %0.2f seconds. Error: %0.1f"
            % (name, n_features, fit_t + pred_t, err)
        )

# set up grid for figures
fig = plt.figure(num=None, figsize=(6, 4), dpi=160)
ax = plt.subplot2grid((2, 2), (0, 0), rowspan=2)

# Graph fit(train) time
feature_number_labels = [str(s) for s in feature_counts]
ax.plot(feature_counts, svc_fit_times, "o--", color="g", label="SVC")
ax.plot(
    feature_counts, eig_fit_times, "o-", color="r", label="EigenPro Classifier"
)
ax.set_xscale("log")
ax.set_yscale("log", nonpositive="clip")
ax.set_xlabel("Number of features")
ax.set_ylabel("time (seconds)")
ax.legend()
ax.set_title("Training Time")
ax.set_xticks(feature_counts)
ax.set_xticklabels(feature_number_labels)
ax.set_xticks([], minor=True)
ax.get_xaxis().set_major_formatter(matplotlib.ticker.ScalarFormatter())

# Graph prediction(test) time
ax = plt.subplot2grid((2, 2), (0, 1), rowspan=1)
ax.plot(feature_counts, eig_pred_times, "o-", color="r")
ax.plot(feature_counts, svc_pred_times, "o--", color="g")
ax.set_xscale("log")
ax.set_yscale("log", nonpositive="clip")
ax.set_ylabel("time (seconds)")
ax.set_title("Prediction Time")
ax.set_xticks([])
ax.set_xticks([], minor=True)

# Graph training error
ax = plt.subplot2grid((2, 2), (1, 1), rowspan=1)
ax.plot(feature_counts, eig_err, "o-", color="r")
ax.plot(feature_counts, svc_err, "o-", color="g")
ax.set_xscale("log")
ax.set_xticks(feature_counts)
ax.set_xticklabels(feature_number_labels)
ax.set_xticks([], minor=True)
ax.set_xlabel("Number of features")
ax.set_ylabel("Classification error %")
plt.tight_layout()
plt.show()
Total running time of the script: (0 minutes 12.211 seconds)