Note
Go to the end to download the full example code
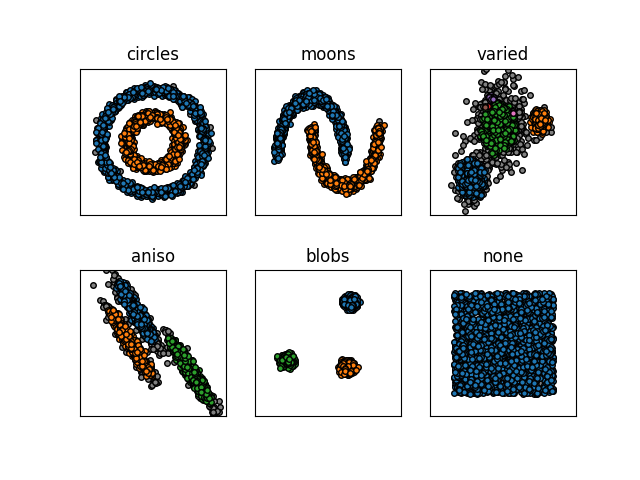
Common-nearest-neighbor clustering demo II
Common-nearest neighbor clustering of data points following a density criterion. Two points will be part of the same cluster if they share a minimum number of common neighbors. Read more in the User Guide. Compare this example to the results for other cluster algorithms.
import matplotlib.pyplot as plt
import numpy as np

from sklearn_extra.cluster import CommonNNClustering
from sklearn import datasets
from sklearn.preprocessing import StandardScaler


print(__doc__)


np.random.seed(42)
n = 2000

# circles
circles, _ = datasets.make_circles(
    n_samples=n, factor=0.5, noise=0.05, random_state=10
)

circles = StandardScaler().fit_transform(circles)

# blobs
blobs, _ = datasets.make_blobs(
    centers=[[-9, -8], [11, -10], [12, 12]], n_samples=n, random_state=10
)

blobs = StandardScaler().fit_transform(blobs)

# moons
moons, _ = datasets.make_moons(n_samples=n, noise=0.05, random_state=10)

moons = StandardScaler().fit_transform(moons)

# no_structure
no_structure = np.random.rand(n, 2)
no_structure = StandardScaler().fit_transform(no_structure)

# aniso
X, y = datasets.make_blobs(n_samples=n, random_state=170)

transformation = [[0.6, -0.6], [-0.4, 0.8]]
aniso = np.dot(X, transformation)
aniso = StandardScaler().fit_transform(aniso)

# varied
varied, _ = datasets.make_blobs(
    n_samples=n, cluster_std=[1.0, 2, 0.5], random_state=170
)

varied = StandardScaler().fit_transform(varied)

fits = [
    ("circles", circles, {"eps": 0.2, "min_samples": 5}),
    ("moons", moons, {"eps": 0.2, "min_samples": 5}),
    ("varied", varied, {"eps": 0.2, "min_samples": 15}),
    ("aniso", aniso, {"eps": 0.18, "min_samples": 12}),
    ("blobs", blobs, {"eps": 0.2, "min_samples": 5}),
    ("none", no_structure, {"eps": 0.2, "min_samples": 5}),
]

fig, ax = plt.subplots(2, 3)
ax = ax.flatten()
for index, (name, data, params) in enumerate(fits):
    cobj = CommonNNClustering(**params).fit(data)
    labels = cobj.labels_
    ax[index].plot(
        *data[np.where(labels == -1)[0]].T,
        linestyle="",
        color="None",
        marker="o",
        markersize=4,
        markerfacecolor="gray",
        markeredgecolor="k",
    )

    for cluster_number in range(0, int(np.max(labels)) + 1):
        ax[index].plot(
            *data[np.where(labels == cluster_number)[0]].T,
            linestyle="",
            marker="o",
            markersize=4,
            markeredgecolor="k",
        )

    ax[index].set(
        **{
            "xlabel": None,
            "ylabel": None,
            "xlim": (-2.5, 2.5),
            "ylim": (-2.5, 2.5),
            "xticks": (),
            "yticks": (),
            "aspect": "equal",
            "title": name,
        }
    )
Total running time of the script: ( 0 minutes 0.297 seconds)